Google Looker Studio Report for Google Ads
 Page 1
 Page 2
 Page 3
 Page 4
 Page 5
What This Template Does
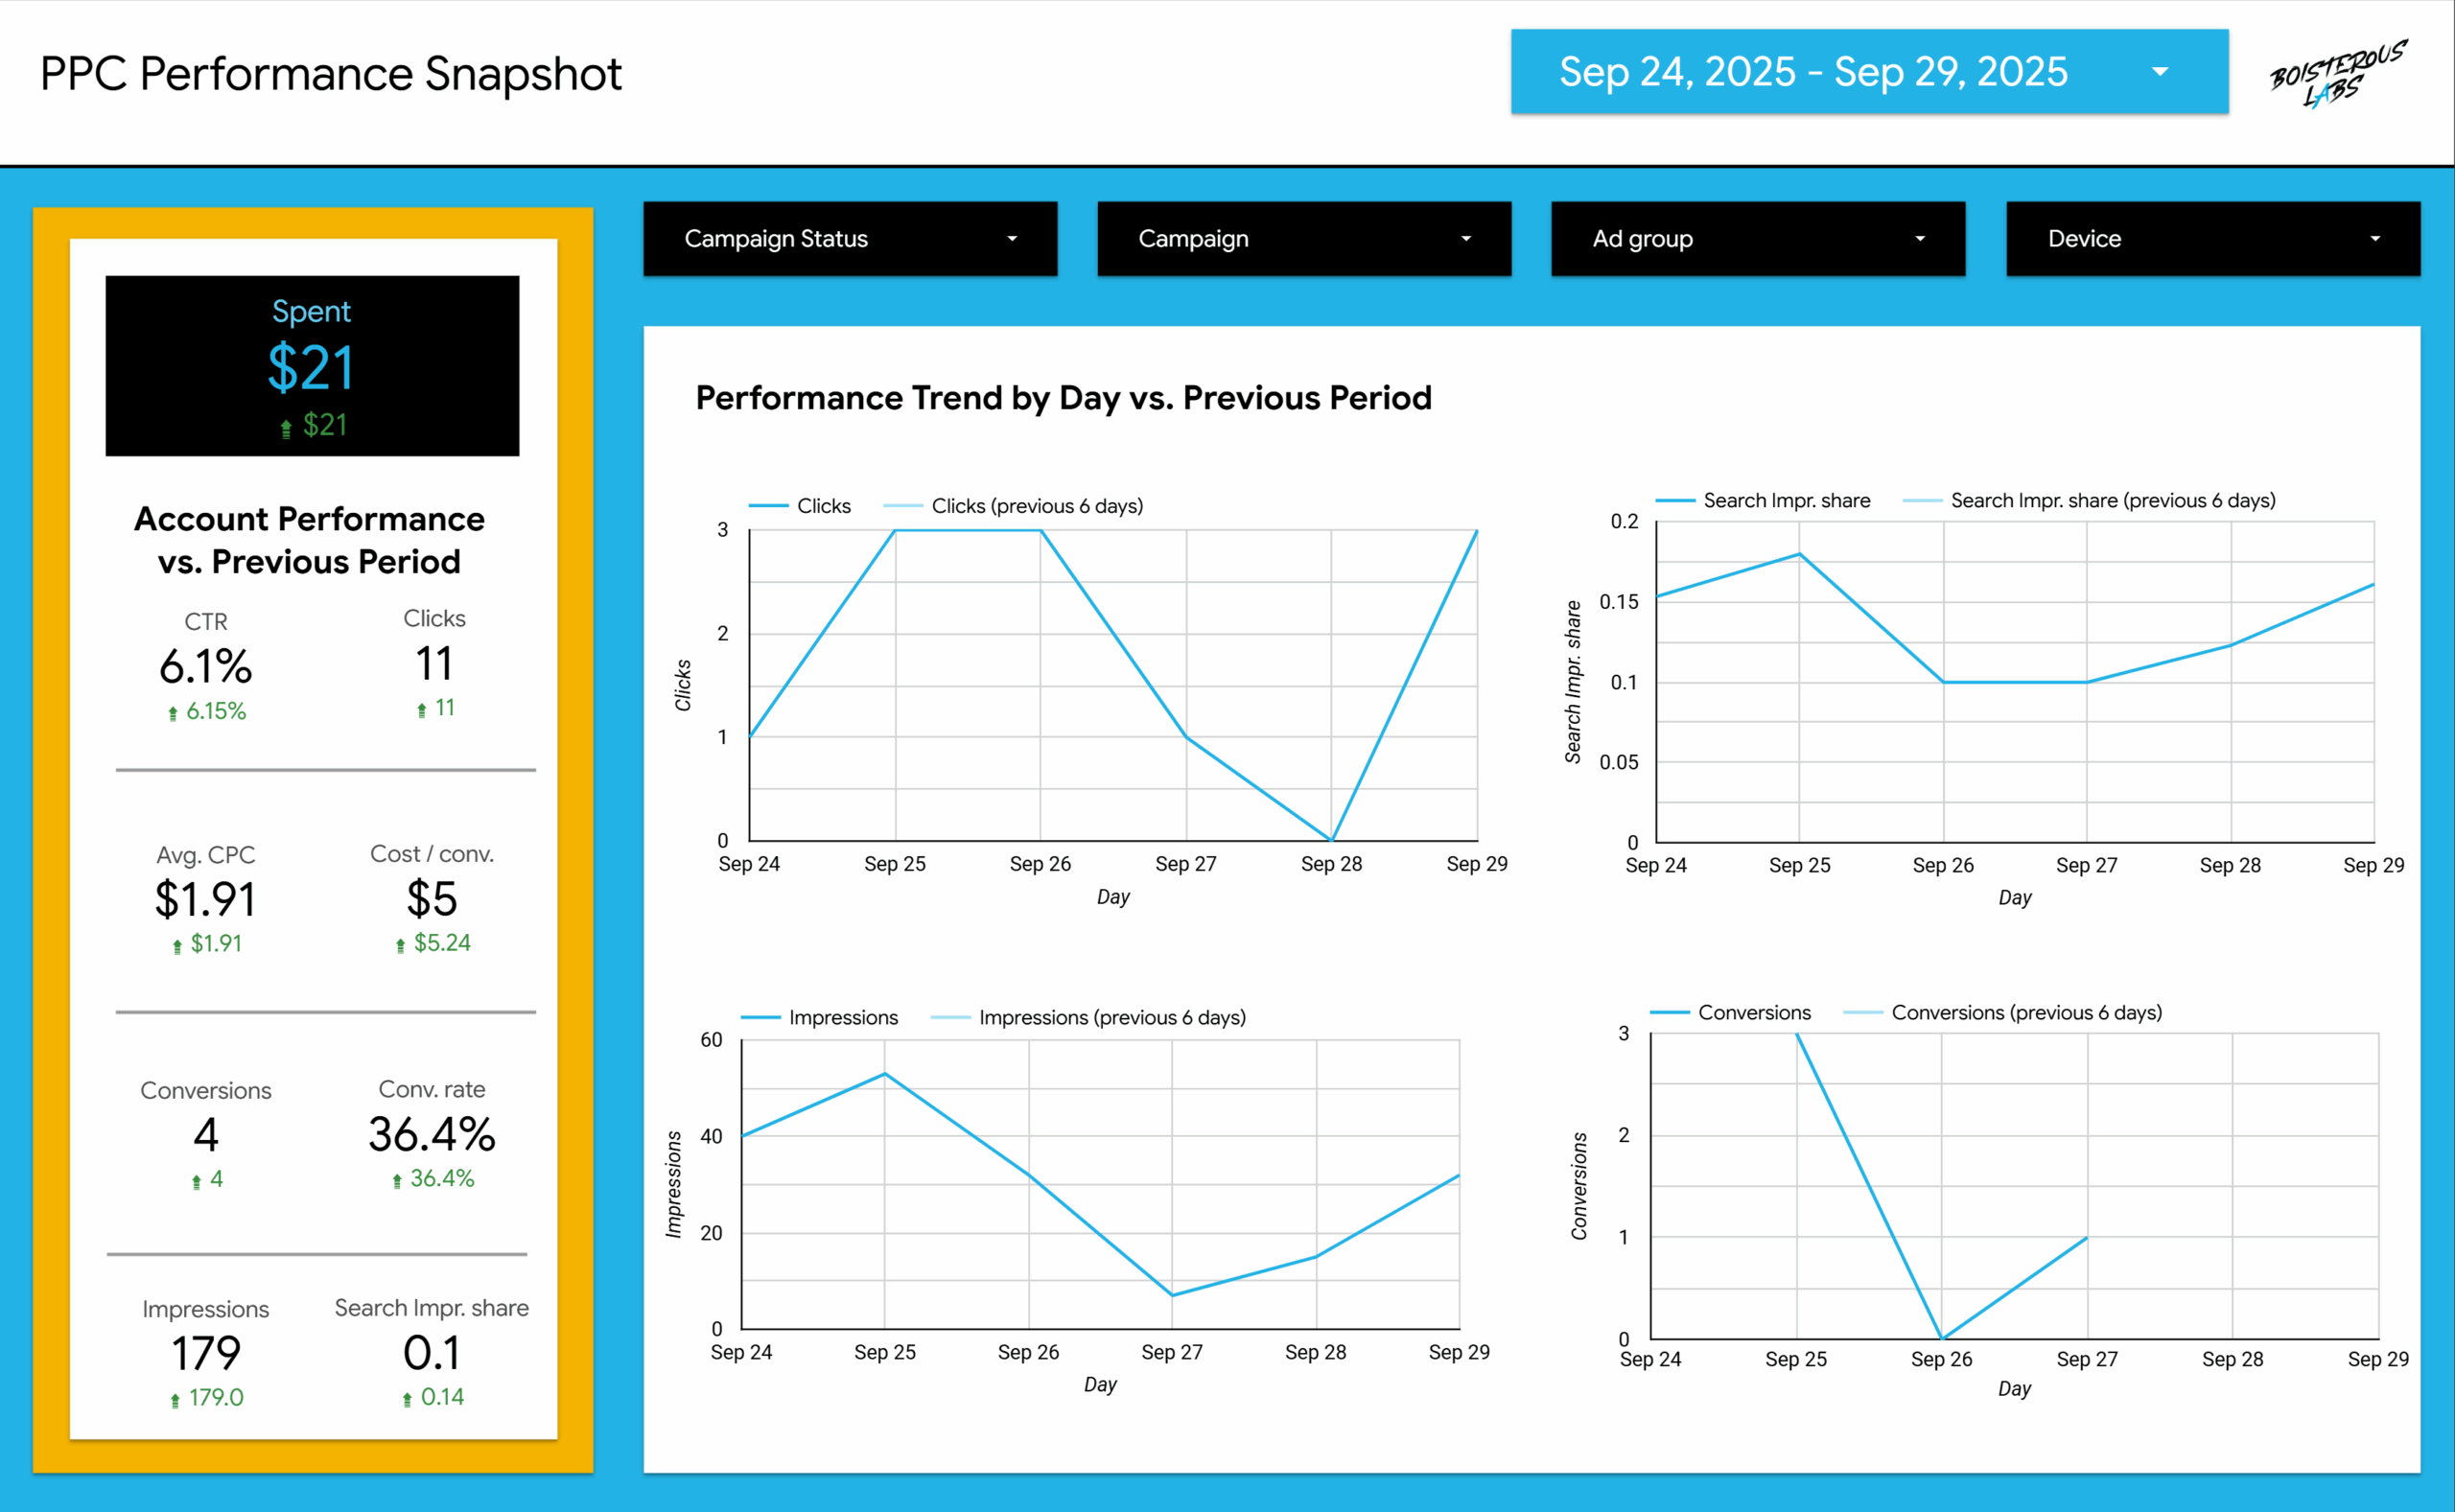
This Google Ads Performance Overview Report template provides a complete snapshot of your paid search activity, giving marketers and business owners clear, data-driven visibility into campaign results across multiple dimensions — including campaigns, ad groups, keywords, search queries, and devices.
Covering key metrics like impressions, clicks, CTR, average CPC, conversion rate, cost per conversion, and search impression share, this report helps you monitor performance trends, validate optimization strategies, and make informed decisions to improve ROI.
The report includes:
- Performance Snapshot – View essential account metrics compared to the previous period.
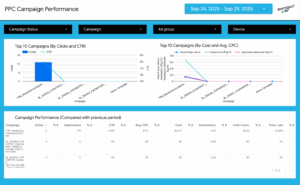
- Campaign & Ad Group Performance – Analyze spend, conversions, and clickthrough rates across campaigns and ad groups.
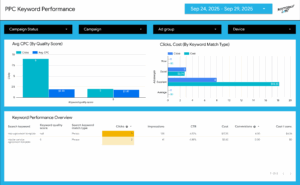
- Keyword & Search Query Insights – Identify which keywords and queries drive engagement or waste spend.
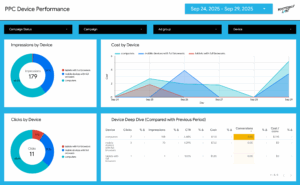
- Device Performance – See how desktop, mobile, and tablet performance impacts overall results.
- Trend Visualizations – Review day-by-day performance shifts through intuitive charts and graphs.
Built directly connected to Google Ads, this Google Looker Studio Google Ads Report template enables you to track campaign health, share professional data-backed reports with clients or stakeholders, and pinpoint optimization opportunities with confidence.
How to Update
How to Copy and Connect Your Data in Google Looker Studio
This guide provides step-by-step instructions for setting up your own version of the Google Ads Performance Overview Report in Google Looker Studio. You’ll copy the existing template, connect it to your data source, and ensure all charts populate correctly.
Step 1: Make a Copy of the Report
- Open the shared Looker Studio report link.
- Click the “⋮” (three-dot menu) in the top-right corner of the report preview.
- Select “Make a copy”.
- A dialog box titled “Copy this report” will appear.
Step 2: Select and Connect Your Data Source
- In the copy dialog, under “New Data Source”, you’ll see a dropdown labeled “Default Data – Click to select your data”.
- Click “Select Data Source”.
- Choose your preferred data connection type:
- Google Ads — If you want to connect directly to your live campaigns.
- Google Sheets — If you’re using exported or offline campaign data.
- BigQuery or CSV — For advanced or custom datasets.
- Click “Add” once your data source is connected.
- Looker Studio will automatically map most of the fields to your existing charts and tables.
Step 3: Map Data Fields (If Needed)
- If a chart shows a “Field not found” warning, edit the chart to reconnect the correct field.
- Click the chart → go to the right sidebar → verify that the Metric and Dimension fields (e.g., Clicks, Impressions, CTR, Cost) match your source.
- Use the “Available Fields” panel to remap any missing metrics.
Step 4: Verify Report Filters and Date Controls
- Check the report’s top bar for date selectors — these control the visible range (e.g., Sep 9, 2025 – Oct 8, 2025).
- Click the date range to adjust for your campaign timeline.
- Ensure filters (e.g., Campaign, Ad Group, Device, Campaign Status) are linked correctly to your data source. Click on a filter and confirm it references the same field names as in your source.
Step 5: Update Branding (Optional)
- Change the report title (e.g., “Google Ads Performance Overview – [Your Business Name]”).
- Update the logo or theme colors in the Theme and Layout settings.
- Customize text boxes, KPI cards, and charts as needed.
Step 6: Share or Publish Your Report
- Click Share → Manage Access to invite collaborators or clients.
- Use View Mode to preview how your data displays before sharing.
- Publish a public or restricted link for your team.
Note: This template is built for dynamic reporting — you don’t need to edit the charts manually. Once your data is connected, the entire dashboard will populate automatically.